

Sales questions deserve fast answers
Sales data drives almost every decision in a fresh produce business: what to plant or source next season, which customers to prioritise, which products to promote, which prices to hold and which to drop. Yet sales analysis is often the slowest part of the week. Data has to be exported, cleaned, pivoted and charted before anyone can see what happened.
Pak-Bot gives anyone with sales access the ability to ask about sales directly. Questions such as "Total sales last month", "Sales by state last month" and "Woolworths sales of baby spinach this year" return answers in seconds, drawn from live Producepak data, as totals, tables or charts.
Core sales questions
- Total sales last month
- Sales by state last month
- Woolworths sales of baby spinach this year
- Walmart orders vs sales Q1 2026
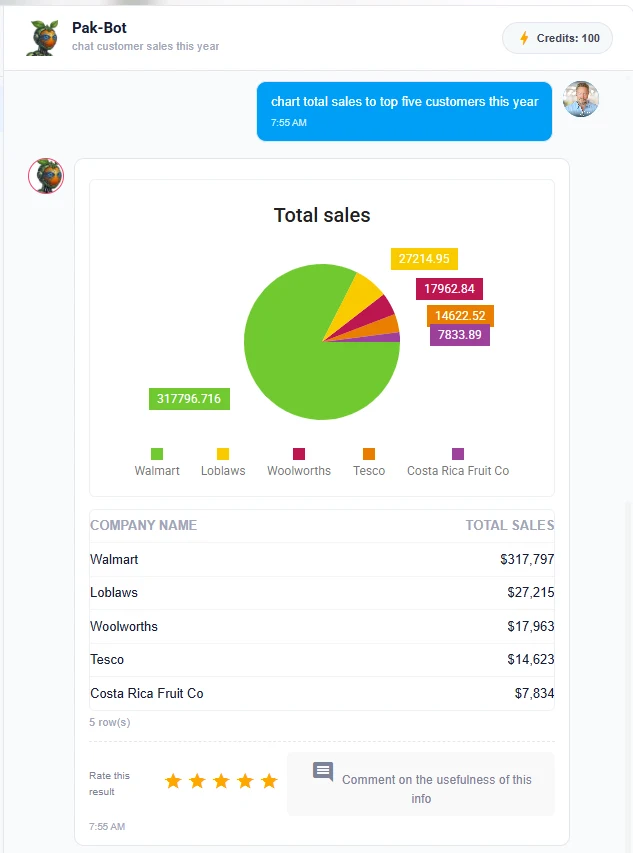
- chart total sales to top five customers this year
- Email Angela Coles sales from Q1
These six prompts cover the main patterns of sales analysis: a headline total, a geographic breakdown, a customer-and-product slice, an order fulfilment comparison, a ranked chart and a shared result.
Headline totals
Total sales last month returns a single figure. It is the fastest way to check how the business is tracking. Variations include "total sales this week", "total sales yesterday", "total sales this year compared to last year" and "total sales of avocados last month".
Headline totals are useful at the start of a management meeting, at the end of a trading day, or whenever someone asks "how are we going?" They take five seconds to get, so there is no reason to wait for month-end.
Breakdowns by geography
Sales by state last month breaks sales into states or regions based on customer delivery addresses. For businesses that ship across a country, this shows where demand is concentrated and where freight costs are being spent.
Ask for a chart to make it visual: "chart sales by state last month". Combine it with a product: "avocado sales by state this year". Compare periods: "sales by state this quarter versus last quarter".
Using geographic analysis
- Plan transport and consolidation around the states with the highest volume.
- Identify regions where sales are growing and where they are falling.
- Support conversations with retailers about distribution centre allocations.
Customer and product analysis
The most common sales question combines a customer and a product. Woolworths sales of baby spinach this year isolates one product line for one retailer. Sales managers use this kind of question before a customer review, when a buyer calls about volume, or when deciding whether a product line is worth keeping.
Top customers
chart total sales to top five customers this year returns a ranked pie chart with a table. In the example below, one customer accounts for most of the year's sales. That kind of concentration is a business risk worth seeing clearly.
Top products
Swap customers for products: "top 10 products by sales value this year", "top products by weight sold last month", "slowest-selling products this quarter". Knowing which products carry the business, and which are taking up space and labour without much return, informs packing and sourcing decisions.
Customer trends
Ask for trends over time: "Loblaws sales by month this year", "chart weekly sales to Tesco". A line chart of a customer's weekly sales shows seasonality, promotions and any slow decline that is easy to miss when looking at single weeks.
Orders versus sales: fill rate analysis
Walmart orders vs sales Q1 2026 compares what a customer ordered with what was actually shipped and invoiced. In fresh produce, the difference between the two is often significant: short-shipments due to supply, substitutions, rejections at the customer's dock, or order changes after picking.
Major retailers measure supplier fill rates closely. Knowing your own figures before the retailer tells you is a strong position in any supplier review. Pak-Bot makes this comparison a single question rather than a reconciliation exercise.
Follow-up questions
- Which Walmart orders were short-shipped in Q1 2026?
- Products with the biggest gap between ordered and shipped this month
- Orders vs sales by customer last month
Sales by salesperson and team
Pak-Bot answers questions about employees as well as customers and products. Sales managers can ask about results by salesperson or account manager, for example "sales by salesperson last month" or "Angela Coles sales from Q1". The prompt Email Angela Coles sales from Q1 both runs the analysis and emails the result.
Because Pak-Bot knows which employees can access sales data, this information stays with the people who should see it. Warehouse staff without sales access cannot retrieve it.
Sharing sales results
Sales analysis usually ends with someone else needing the result: a manager, a customer, a grower or the board. Pak-Bot can email and print results directly, so there is no export step. Ask Pak-Bot to email a result to a named person, or print it for a meeting. More detail is on the labels, email and print page.
Common sharing patterns
- Weekly sales to management: "Email total sales last week by customer to the management team".
- Customer review packs: "Email Woolworths sales of baby spinach this year to me" before a buyer meeting.
- Salesperson results: "Email Angela Coles sales from Q1".
Sales analytics for different fresh produce businesses
Packers selling to retail
Retail customers drive volume and set strict specifications. Focus on customer-and-product analysis, fill rates, and weekly trends around promotions.
Wholesalers and market agents
Wholesale sales involve many customers and frequent price changes. Focus on sales by customer, by product and by day, and on which customers are growing or dropping off.
Importers and exporters
International trade adds countries, containers and longer lead times. Ask about sales by destination, by shipment or by product origin.
Fresh-cut and food service processors
Food service customers order frequently and in consistent volumes. Focus on order regularity, fill rate and product mix by customer.
Better prompts for better sales analysis
Pak-Bot handles natural language well, but sales questions benefit from clarity on four points.
- Measure: sales value, units, cartons or weight. If you do not say, Pak-Bot will usually report value.
- Period: name it explicitly. "This year" and "Q1 2026" are clear; "recently" is not.
- Customer and product names: use the names as they appear in Producepak.
- Output: say "chart", "table" or "total" to get the format you want.
Tip: start broad, then narrow. Ask for total sales last month, then sales by customer last month, then the biggest customer's sales by product. Each step uses the previous answer to decide what to ask next.
Where the numbers come from
Pak-Bot reads sales from the same Producepak records used for invoicing and accounting integration. Producepak connects to accounting systems including Xero, QuickBooks, MYOB and Sage, so the sales Pak-Bot reports are consistent with what flows to your accounts. Pak-Bot does not estimate or invent numbers; the language model interprets the question, and the figures come from your data.
For formal financial reporting, confirm figures in your accounting system. For daily decisions, Pak-Bot's live answers are faster and more current than any export.
Sales data and permissions
Sales data is commercially sensitive. Pak-Bot knows which employees can access sales data, and filters accordingly. A packing floor supervisor can ask Pak-Bot about stock and yield but cannot retrieve customer sales figures unless their role allows it. Users assigned to particular sites see results filtered to those sites. Your business data, excluding the prompt text, stays on Producepak servers and is not sent to ChatGPT. See data security and permissions.
Customer concentration and risk
Many fresh produce businesses depend heavily on a small number of large customers. That can be efficient, but it is also a risk: losing one program can remove a large share of revenue overnight. The top-five-customers chart shown above is a quick way to measure this. If one customer dominates the chart, the business should know it, plan for it and consider whether to grow other accounts.
Useful follow-up prompts include "share of sales from the top customer this year", "sales by customer this year compared to last year" and "customers whose sales grew this year". These turn a single chart into a discussion about where the business should focus.
Seasonality and promotions
Fresh produce sales follow the season and the retail promotion calendar. A product can sell three times its normal volume in a promotion week, then drop below normal the week after. Looking at monthly totals hides these swings. Ask Pak-Bot for weekly or daily views: "chart weekly sales of avocados to Loblaws this year" shows the promotion peaks and helps plan supply for the next one.
Year-on-year comparisons are especially useful in seasonal businesses. "Sales of red onion by week this season compared with last season" shows whether the season is starting earlier, later or at a different level.
Weekly sales review template
A simple weekly sales review using Pak-Bot might follow this sequence:
- Total sales last week compared to the week before
- Sales by customer last week
- Top 10 products by sales value last week
- Orders vs sales by customer last week
- Customers who have not ordered in 30 days
The first three show what happened. The fourth shows whether customers received what they ordered. The fifth highlights accounts that may be drifting away. Each result can be emailed to the sales team in the same conversation.
Sales, inventory and quality together
Sales questions often lead to inventory and quality questions. If sales of a product are lower than orders, the cause may be stock shortage (ask about inventory) or quality problems (ask about quality and yield). Because Pak-Bot reads a single Producepak database, you can follow the trail from a sales number to its cause in the same conversation.
Sales data for grower conversations
For marketers and packers selling on behalf of growers, sales data is also grower data. Growers want to know where their product went, at what price and how quickly it sold. Pak-Bot can answer questions such as "sales of product owned by ACE Farming Group this month by customer" for users with sales access, and email the result to the grower contact. Combined with Producepak's grower payment features, this gives growers clear, timely information about their product and reduces the number of calls the office receives asking the same questions every week.
Avoiding common sales analysis mistakes
- Mixing units: compare like with like. Ask for weight or value, not a mix of cartons and kilograms.
- Partial periods: "this month" on the 10th is not comparable with all of last month. Compare the same number of days, or complete periods.
- Credits and returns: check whether you want gross sales or sales after credits before comparing with accounting figures.
Sales questions for the next season
Sales history is the best starting point for planning the next season. Ask Pak-Bot for weekly sales by product for the last season, peak weeks by customer and the products that grew or declined. Share the results with growers and purchasing so planting, sourcing and packing capacity match the demand you actually saw, rather than last year's assumptions.
Sales analytics FAQ
Can Pak-Bot compare this year with last year?
Yes. Ask for both periods in the same prompt, for example "total sales this year compared to last year" or "Woolworths sales by month this year versus last year".
Can Pak-Bot show sales by state or region?
Yes. "Sales by state last month" breaks sales down by the state of the customer delivery address.
Can Pak-Bot compare what a customer ordered with what was shipped?
Yes. Prompts such as "Walmart orders vs sales Q1 2026" compare ordered quantities with sales.
Can I send sales results to someone else?
Yes. Ask Pak-Bot to email the result, for example "Email Angela Coles sales from Q1".
Can every employee see sales data through Pak-Bot?
No. Pak-Bot only returns sales data to employees whose role allows sales access.
Related pages
Read about AI reports and charts, converting purchase orders into sales orders, and inventory questions. For dozens more sales prompts, see the prompt library. To see Pak-Bot on your own sales data, book a demo.