
Quality and yield decide the margin
In fresh produce, two numbers decide whether a packing run makes money: the quality of what comes in, and the yield of saleable product that goes out. A load of fruit that looks fine on the truck can pack out at 60 percent instead of 85 percent because of bruising, sizing or defects. A supplier whose quality slips for three deliveries in a row can cost a business a retail program. Yet quality and yield data often sit in inspection forms and packing sheets that nobody has time to analyse.
Producepak captures quality inspections and packing results as part of normal operations. Pak-Bot makes that data available as questions. Ask about inspection results, rejection rates, supplier quality trends or packout yield, and Pak-Bot returns the answer as a table or chart, filtered to the sites and data you can see.
Quality control questions Pak-Bot answers
Pak-Bot currently answers questions about quality control and yield along with inventory, sales, orders, employees, suppliers and customers. That means quality questions can be combined with supplier, product and site information in the same prompt.
- Rejection rate by supplier this quarter
- Quality inspections that failed last week
- Most common defects in tomatoes this month
- Chart average quality score by grower this season
- Inspection results for lot 4471
- Suppliers with more than two rejected loads this month
The exact wording depends on how your Producepak quality inspections are set up, because Producepak lets each business define its own inspection criteria for incoming, in-process and finished product. Pak-Bot reads those inspections as they exist in your system.
How Producepak captures quality data
Producepak's quality inspection is flexible. Businesses design their own inspection templates for different stages and products: incoming receival checks, in-process checks on the packing line and finished-goods checks before dispatch. Inspectors record measurements, defects, scores and photos, and Producepak can alert people when results require corrective action.
Incoming inspections
Receival inspections check product as it arrives from growers or suppliers: temperature, maturity, size, colour, defects, foreign matter and packaging condition. These results drive accept, reject or downgrade decisions and form the record of supplier performance.
In-process inspections
On the packing line, inspections check grading accuracy, pack weights, label accuracy and presentation. Catching a problem mid-run is much cheaper than catching it at the customer's dock.
Finished goods inspections
Before dispatch, finished goods checks confirm the product meets the customer specification. For retail programs with strict specifications, these records protect the business if a delivery is later disputed.
Corrective actions
When an inspection fails, Producepak can trigger corrective action alerts so the right person responds. Pak-Bot can then answer questions about how often that happens, for which products and suppliers, and whether it is improving.
Supplier quality performance
Supplier performance is one of the most valuable uses of quality data and one of the most under-used. Most businesses have a feeling about which growers or suppliers are reliable. Few have the numbers to back it up in a commercial conversation.
With Pak-Bot, the numbers are a question away. "Rejection rate by supplier this quarter" ranks suppliers by how often their product failed inspection. "Chart average quality score by grower this season" shows the spread visually. Follow-ups such as "which defects caused Grower C's rejections?" turn a ranking into a specific conversation with the grower.
Using supplier quality data
- Grower feedback: share objective results with growers so they can fix problems in the field or in harvest handling.
- Buying decisions: weight purchasing towards suppliers with consistent quality.
- Pricing and claims: support price adjustments or claims with inspection records rather than impressions.
- Program allocation: allocate the best-quality supply to the most demanding retail programs.
Pak-Bot can email results directly, so a grower liaison can send a grower their quality summary without building a report. See labels, email and print.
Yield: what you put in versus what you sell
Yield, also called packout, is the share of incoming product that becomes saleable packed product. If 10,000 kg of potatoes are received and 8,200 kg are packed as first-grade product, the first-grade yield is 82 percent. The remaining 1,800 kg may be second grade, processing grade or waste. Each category has a very different value.
Producepak tracks product from receival through packing, so it can calculate yield by grower, by lot, by product, by packing line and by period. Pak-Bot makes that yield information easy to reach.
Yield questions Pak-Bot answers
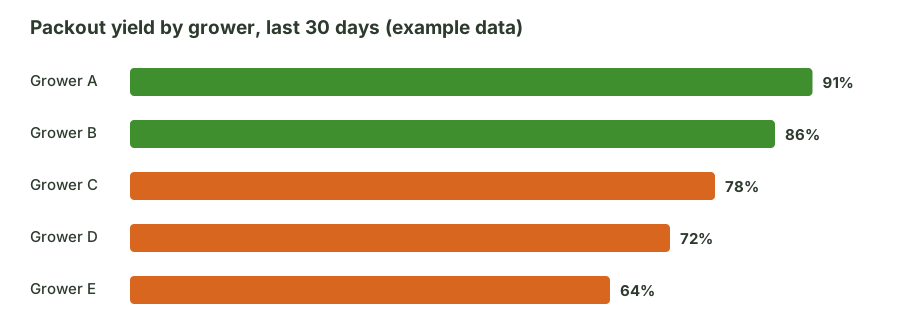
- Chart yield by grower last 30 days
- Average packout for avocados this month
- Yield by packing line this week
- Lots with yield below 75 percent this month
- Waste by product last quarter
Why yield by grower matters
When growers are paid on packed-out product, yield directly affects grower payments. When growers are paid on received weight, yield directly affects the packer's margin. Either way, both parties need to see it. Producepak's grower payment features handle settlement calculations; Pak-Bot gives fast visibility into the yields that feed them.
Why yield by line matters
Two packing lines handling the same product should produce similar yields. A persistent gap points to grading settings, equipment wear, line speed or training. Comparing yield by line each week turns a hidden cost into a visible one.
Connecting quality, yield and sales
Because Pak-Bot reads a single Producepak database, it can connect quality and yield to inventory and sales. A drop in yield for a product affects how much is available to sell. A spike in rejections from one supplier may explain why a retailer order was short-shipped. Questions like "Walmart orders vs sales Q1 2026" in sales analytics often lead back to quality and yield as the root cause.
A typical investigation might run like this:
- Walmart orders vs sales Q1 2026: orders were short-shipped on baby spinach.
- Baby spinach yield by week Q1 2026: yield dropped in weeks 6 to 8.
- Baby spinach rejection rate by supplier weeks 6 to 8: one supplier's rejections tripled.
- Most common defects for that supplier weeks 6 to 8: the defects point to a specific handling problem.
Four questions, a few minutes, and the business has a clear story to take to both the retailer and the supplier.
Quality data and traceability
Quality records and traceability records belong together. If a customer reports a problem, the business needs to trace the carton back to the lot, the lot back to the receival, and the receival back to the grower, then see the inspection results at each stage. Producepak's traceability and recall features link these records. Pak-Bot lets you ask about them directly: "Inspection results for lot 4471", "Which customers received product from lot 4471?"
For businesses subject to the FDA Food Traceability Rule (FSMA section 204), the ability to produce linked records quickly matters. The rule requires covered businesses to provide traceability records to the FDA within 24 hours of a request, as a sortable spreadsheet in some circumstances. Producepak's traceability records are the formal source; Pak-Bot speeds up the investigation that goes with them.
Quality and yield for different operations
Fruit packers
Size, colour, maturity and defects drive grade. Yield by grower and by size grade informs both grower payments and sales planning.
Vegetable packers
Trim loss, size grading and defects affect yield. Comparing yield by line and shift highlights process issues.
Fresh-cut processors
Processing yield from raw material to finished cut product is central to cost control. Quality checks on shelf life and appearance protect food service and retail programs.
Importers and wholesalers
Arrival inspections on imported product support claims against shippers and decisions on how fast to sell each consignment.
Building a quality and yield routine with Pak-Bot
The value of quality and yield data comes from looking at it regularly. A simple weekly routine using Pak-Bot might be:
| When | Who | Prompt |
|---|---|---|
| Daily | QA supervisor | Quality inspections that failed yesterday |
| Daily | Packing manager | Yield by packing line yesterday |
| Weekly | Quality manager | Rejection rate by supplier last week |
| Weekly | Grower liaison | Chart yield by grower last week |
| Monthly | General manager | Waste by product last month |
Each of these takes seconds, and each can be emailed to the people who need to act on it.
Getting accurate quality and yield answers
- Record inspections in Producepak at the time they happen, not later from paper.
- Use consistent inspection templates so results are comparable across suppliers and periods.
- Record packing outputs, including second grade and waste, so yield calculations are complete.
- Rate Pak-Bot answers and comment when a quality term or yield measure is misunderstood, so the team can train Pak-Bot on your terminology.
Calculating yield: a worked example
Yield calculations are simple in principle but easy to get wrong in a spreadsheet, especially when product moves between grades, lots and lines. Here is an illustrative example of how a potato lot might pack out.
| Output | Weight (kg) | Share of intake |
|---|---|---|
| Intake from grower | 10,000 | 100% |
| First grade, 2 kg bags | 7,400 | 74% |
| First grade, 10 kg cartons | 800 | 8% |
| Second grade | 1,100 | 11% |
| Processing grade | 400 | 4% |
| Waste and moisture loss | 300 | 3% |
First-grade yield here is 82 percent (8,200 kg of 10,000 kg). Producepak records each output against the lot, so Pak-Bot can return yield for this lot, for every lot from the grower, or for every grower this season, without anyone rebuilding the calculation. Figures in this table are illustrative.
Quality and yield metrics worth tracking
- First-grade yield: share of intake packed as top-grade product.
- Waste percentage: share of intake discarded, a direct cost and a sustainability measure.
- Rejection rate: share of loads or lots rejected at receival or before dispatch.
- Defect frequency: how often each defect type appears, by product and supplier.
- Customer rejections: deliveries rejected or claimed by customers, linked back to lots.
- Inspection completion: whether required inspections were actually done.
Each of these can be asked of Pak-Bot as a total, a breakdown or a trend, provided the underlying inspections and packing outputs are recorded in Producepak.
From numbers to conversations
Quality and yield data are most valuable when they change behaviour. Share supplier quality summaries with growers regularly, not only when something goes wrong. Review yield by line with packing supervisors each week. Show customers your own fill rate and quality data before their reviews. Pak-Bot makes the numbers quick to produce, so these conversations can happen weekly rather than once a season.
Photos and evidence
Inspection records are more persuasive with evidence. Where your Producepak inspection templates include photos, attach them at the time of inspection. When a grower or customer disputes a result, the combination of a Pak-Bot summary ("rejected loads for this grower this month") and the underlying inspection records with photos gives a clear, factual basis for the conversation. Disputes are resolved faster when both sides are looking at the same records rather than at memories of what a load looked like on the day it arrived.
Sharing results with growers
Growers respond best to regular, factual feedback. A short monthly summary of quality scores, rejections and yield for each grower, emailed from Pak-Bot, keeps growers informed and makes difficult conversations easier when results fall. Growers who see their own numbers improve over a season also gain a clear reason to keep supplying your business rather than a competitor.
Quality and yield FAQ
Can Pak-Bot answer questions about my own inspection criteria?
Yes. Producepak lets you define your own inspection templates, and Pak-Bot reads quality results as they are recorded in your system.
Can Pak-Bot calculate yield by grower?
Yes. Producepak tracks product from receival through packing, so Pak-Bot can return yield by grower, lot, product, line or period.
Can I send a grower their quality results?
Yes. Ask Pak-Bot to email the result to the grower contact.
Is the yield chart on this page real customer data?
No. The yield chart on this page uses illustrative example data.
Related pages
Read about inventory questions, sales analytics and AI reports and charts, or browse the prompt library. To see Pak-Bot answering quality and yield questions on data like yours, book a demo.