

Reporting that starts with a question
Traditional business software gives you a menu of fixed reports. Each one was designed for a question somebody asked years ago. When your question is slightly different (a different date range, a different customer group, one product instead of a category), you either compromise with the closest report or export the data and rebuild it in a spreadsheet. In a fresh produce business, where questions change daily, that compromise costs time and leads to decisions based on the wrong numbers.
Pak-Bot reverses the process. You start with the question, written in plain language, and Pak-Bot builds the report to fit it. It uses generative AI to interpret what you asked, works out which Producepak data answers it, applies your permissions, and returns the result as a table or chart. If you want it a different way, you ask again.
This is what Pak-Bot means by "instant ad hoc reports at any time." Ad hoc means made for this purpose, right now. You are not limited to the reports someone thought to build in advance.
From prompt to chart in one step
Ask for a chart and Pak-Bot draws one. The prompt chart total sales to top five customers this year returns a pie chart of the five largest customers by sales value, with a legend and a table beneath it showing each company name and its total. You can read the chart at a glance and still see the exact numbers.
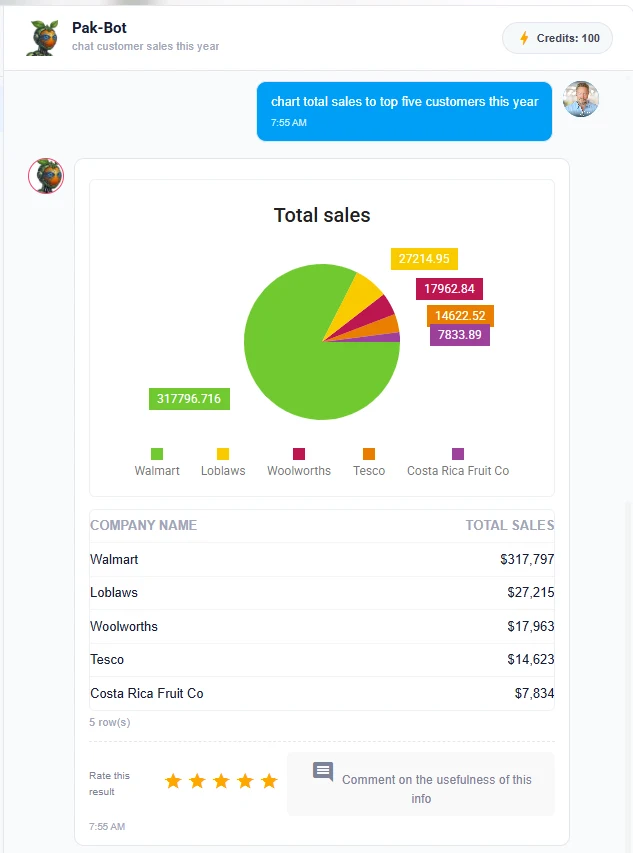
Chart types
Pak-Bot chooses a sensible chart for the question, and you can ask for a specific type. Useful patterns include:
- Pie charts for share of a total: sales by customer, inventory by product group, stock by owner.
- Bar charts for comparisons across categories: sales by state, yield by grower, rejections by supplier.
- Line charts for trends over time: weekly sales of a product, daily packing volume, monthly rejection rate.
- Tables for detail: the ten oldest inventory items, every open order for a customer, inspection results for a lot.
If the chart is not the one you wanted, say so: "show that as a bar chart", "by month instead", "only the top three". Pak-Bot treats each follow-up as a refinement of the same report.
What you can report on
Pak-Bot answers questions across the main areas of Producepak: inventory, sales, orders, employees, suppliers and customers, quality control and yield. Because these areas share a single database, you can combine them in one question.
| Area | Example measures | Example prompt |
|---|---|---|
| Sales | Value, units, weight by customer, product, state, period | Sales by state last month |
| Orders | Ordered vs shipped, open orders, late orders | Walmart orders vs sales Q1 2026 |
| Inventory | Stock on hand, age, weight, location, owner | Weight of totes in stock |
| Quality | Inspection results, defects, rejection rate | Rejection rate by supplier this quarter |
| Yield | Packout percentage, waste, grade split | Chart yield by grower last 30 days |
| Customers and suppliers | Activity, volumes, trends | Top 10 suppliers by weight received this year |
Why ad hoc AI reporting beats fixed reports
No report backlog
In most companies, a request for a new report goes into a queue. Somebody has to specify it, somebody has to build it, and by the time it is ready the question has changed. With Pak-Bot there is no queue. The person with the question gets the answer directly.
No spreadsheet rebuilding
Exporting to a spreadsheet creates a copy of the data that is out of date the moment it is saved. Formulas break, filters are left on by mistake, and different people end up with different versions of the truth. Pak-Bot queries live Producepak data every time, so every answer reflects the current state of the business.
Questions in your own words
Fresh produce has its own vocabulary: totes, bins, flats, clamshells, poly bags, packout, grade, lot, consignment. Pak-Bot understands product names and packaging types as they exist in your Producepak setup. "Red onion in poly bags" is a valid question because Producepak knows which products are red onion and which packaging is a poly bag.
Faster follow-up questions
The first answer usually leads to a second question. Sales to a retailer are down; which products? Which weeks? Which sites shipped them? With fixed reports, every follow-up means another report or another export. With Pak-Bot, every follow-up is another sentence in the same conversation.
Writing prompts that produce good reports
Pak-Bot handles loose wording well, but specific prompts produce cleaner reports. A good reporting prompt usually contains four parts.
- The measure: sales value, units, weight, number of orders, yield percentage, rejection rate.
- The breakdown: by customer, by product, by state, by site, by grower, by week.
- The filter: a customer, product, site, supplier or packaging type.
- The period: today, last week, last month, Q1, this year, a date range.
Compare "sales" with "Sales of baby spinach to Woolworths by week this year as a line chart". The second prompt tells Pak-Bot the measure (sales), the filter (baby spinach, Woolworths), the breakdown (by week), the period (this year) and the presentation (line chart). You do not need all five parts every time, but adding them removes ambiguity.
Use names exactly as they appear in Producepak
Pak-Bot matches customer, product and site names to your Producepak records. If a customer is set up as "ACE Farming Group", use that name rather than an internal nickname. Over time, ratings and comments help Pak-Bot learn the shorthand your team uses.
Ask for the format you need
Say "chart", "table", "list" or "total" to control the output. "Total sales last month" returns a single figure. "Sales by state last month" returns a breakdown. "Chart sales by state last month" returns a chart.
Reporting examples by role
General manager: weekly business review
- Total sales last week compared to the week before
- Chart sales by customer this month
- Top 10 products by sales value this year
- Sales by state last month
Four prompts produce a weekly review pack that would otherwise take hours to assemble. Each result can be emailed to the management team directly from Pak-Bot.
Sales manager: customer meeting preparation
- Woolworths sales of baby spinach this year
- Walmart orders vs sales Q1 2026
- Chart Loblaws sales by product last quarter
The orders-versus-sales comparison is especially valuable before a retailer meeting. It shows whether you shipped what the customer ordered, and where short-shipments happened.
Operations manager: stock and throughput
- Total of inventory at site Closters
- List the 10 oldest inventory items
- Weight of totes in stock
Quality manager: supplier performance
- Rejection rate by supplier this quarter
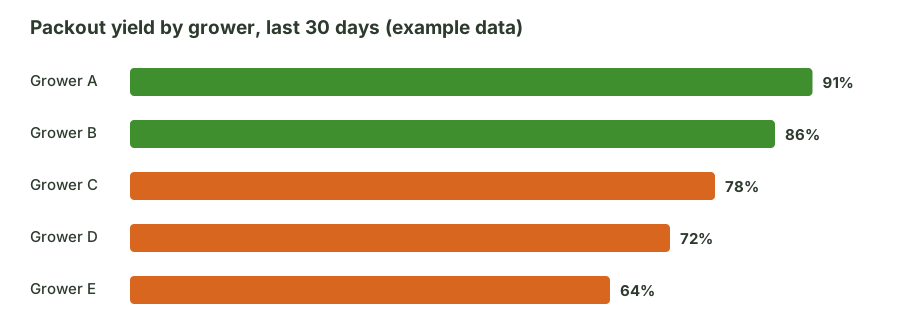
- Chart yield by grower last 30 days
Sharing reports: email and print
A report is only useful if it reaches the people who act on it. Pak-Bot can email and print reports directly. Email Angela Coles sales from Q1 sends the result to Angela. You can also ask Pak-Bot to print a report for a meeting or for the packing floor. Details are on the labels, email and print page.
Accuracy and trust
AI reporting raises a fair question: how do you know the answer is right? Pak-Bot addresses this in three ways.
It queries your data, it does not guess
Pak-Bot uses the language model to understand the question, then runs a query against Producepak data. The numbers in the answer come from your database, not from the language model's general knowledge. Tables are shown alongside charts so you can check the figures.
It shows what it returned
Each answer shows the rows it returned, with a row count. If you asked for the ten oldest inventory items, you can see all ten, with inventory numbers that link to the inventory record in Producepak.
It learns from your feedback
The star rating and comment box under every answer exist so that wrong or incomplete answers get fixed. If Pak-Bot misreads a product name or picks the wrong date field, tell it in the comment. The Producepak team uses that feedback to train Pak-Bot.
Good practice: for figures that go into financial statements or customer invoices, use Pak-Bot to find and explore the numbers quickly, then confirm against the standard Producepak report or your accounting system before publishing externally.
Reports respect permissions
Pak-Bot knows which employees can access sales data and which employees work at which site. A user without sales access cannot ask Pak-Bot for sales figures and get them. A user assigned to one site sees that site's data. This means you can give Pak-Bot to the whole team without creating a back door into sensitive information. The data security page explains this in more detail.
Common reporting questions answered
Can Pak-Bot replace all of my standard reports?
Pak-Bot is best for ad hoc questions and quick analysis. Standard Producepak reports and documents such as invoices, bills of lading and compliance records remain available and are the right tool for formal, repeatable output.
Can I get a chart and a table together?
Yes. When Pak-Bot draws a chart it also shows the underlying table, so you can read exact values.
Does Pak-Bot use live data?
Yes. Pak-Bot queries current Producepak data each time you ask, so the answer reflects the latest receivals, packing, orders and sales.
What date ranges does Pak-Bot understand?
Common phrases such as today, yesterday, last week, last month, this year, Q1, Q2 2026 and explicit date ranges. If a period is ambiguous, state the dates directly.
Next steps
Start with the questions you ask most often and type them into Pak-Bot exactly as you would ask a colleague. For inspiration, browse the Pak-Bot prompt library, or read how Pak-Bot handles inventory, sales analytics and quality and yield. If you are not yet using Producepak, book a demo and see ad hoc AI reporting on data that looks like your own operation.
Ad hoc reporting versus traditional business intelligence
Many fresh produce businesses have looked at business intelligence (BI) tools such as dashboards connected to a data warehouse. Those tools are powerful, but they come with a cost that is easy to underestimate: someone has to model the data, build and maintain the dashboards, and train users to filter and drill down. In a mid-sized packhouse, that someone is usually already busy with something else, and the dashboards slowly fall out of date.
Pak-Bot takes a different approach. There is no separate data warehouse and no dashboard to maintain. The data is already structured inside Producepak, and Pak-Bot reads it directly. Each question creates its own report, so there is nothing to keep up to date.
| Fixed reports | BI dashboards | Pak-Bot | |
|---|---|---|---|
| Setup effort | Built per report | Data model plus dashboards | None beyond Producepak |
| New question | New report request | New dashboard or filter | New sentence |
| Data freshness | Live or scheduled | Depends on refresh schedule | Live Producepak data |
| Skills needed | Report menu knowledge | Filtering and drill-down | Plain language |
| Permissions | Per report | Separate configuration | Inherited from Producepak roles and sites |
| Sharing | Export and attach | Share link | Email or print from the prompt |
Dashboards still have a place for numbers that are watched constantly, and Producepak includes logistics, sales and profit dashboards for that. Pak-Bot covers everything in between: the hundreds of one-off questions that no dashboard was designed for.
Reporting in seasonal businesses
Fresh produce is seasonal, and reporting needs change through the year. Before the season, the questions are about last year's volumes, customer programs and grower intake. During the peak, the questions are about today's stock, today's orders and this week's yield. After the season, the questions are about grower settlement, supplier performance and what to change next year.
A fixed report set built for one part of the season is rarely right for the others. Pak-Bot adapts because the question defines the report. Useful seasonal prompts include "sales by product this season compared with last season", "weight received by grower this season" and "chart weekly packing volume this season".
Speaking your reports
The microphone button in the Pak-Bot chat box means reports can be requested by voice. A manager walking the packing floor can ask "total of inventory at site Closters" without stopping to type. A sales manager on the road can ask for a customer's sales before walking into a meeting. Spoken prompts follow the same rules as typed ones: be specific about the measure, the subject and the period.